Devpost
Participate in our public hackathons
Devpost for Teams
Access your company's private hackathons
Grow your developer ecosystem and promote your platform
Drive innovation, collaboration, and retention within your organization
By use case
Blog
Insights into hackathon planning and participation
Customer stories
Inspiration from peers and other industry leaders
Planning guides
Best practices for planning online and in-person hackathons
Webinars & events
Upcoming events and on-demand recordings
Help desk
Common questions and support documentation
It is commonly suspected that poverty in its various forms has a negative effect on the educational achievements of an area.
We analyzed the data of school districts with different models to try to understand the correlation between different factors of the school district on mortgage factors, poverty, and etc.
How do we improve retention rates for students in poverty?
Analyzing funding levels among school districts is crucial for understanding & addressing educational inequities, which impact the opportunities & outcomes of students in different regions.
KAcTcus and Analasso stayed vigilant on the dessert plains of San Pedro 1. They trekked to their final destination of their first rodeo (the beginners track). In the Rowdy Rowdy West.
An analysis on AP and Dual-Credit enrollment in schools
I'm a 1st time participant of a datathon/hackathon. I started at beginner level, but I added some coding to create & combine a dataset. From a Mom with limited time this weekend, it was fun!
analysis of educational and socioeconomic data
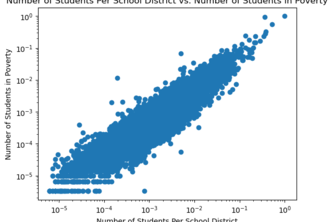
We draw the graph about the number of students per school district (The task for beginner)
In this hackathon project, we explore a variety of education metrics to gain valuable insights regarding educational attainment in relation to socioeconomic and environmental factors.
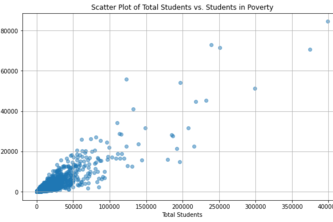
To analyze the relationship between several student characteristics and the estimated number of children in poverty across the top 50 school districts in Texas
A common misconception may be that CBSAs correlate to how densely populated a certain area is; HOWEVER, this is NOT TRUE. Using this knowledge and other data we were able to make interesting finds.
Our project analyzes socioeconomic factors using CRDC data to guide resource allocation for better education in congressional districts.
School districts have many different populations. Are we reaching every student in every district equally? Are their parents able to own homes in these districts? Our analysis considers this question.
Datathon 2023
Once upon a digital dawn, we were just like you - young, aspiring, and lost in the vast world of Python and SQL. Remember the frustration of watching a CSV file upload via the SQL shell?
All of our first datathon, we did it in intermediate. We used data science libraries like numpy, and matplotlib to make data vizualization
Analyzing demographics in education along with poverty in schools.
Using our knowledge gained today, to help the children of the future.
We found that Texas has harsher economics compared to other states. We see little effect in the number of students enrolled in advanced mathematics with better economic outcomes.
New users to data science
define a correlation between the amount of financial resources available for students versus the student's access to seemingly scarce resources, such as certified teachers for the courses.
It can only go up from here!
1 – 23 of 23